

This chapter examines population and land use characteristics in the County’s planning jurisdiction.
Planning Area Population
Population and population characteristics help to explain the condition of an area. This discussion will describe changes in the characteristics and dynamics of Douglas County’s population.
The County’s population has experienced strong growth and has more than doubled in population since 1940. The County has experienced steady growth between 1940 and 1970 and since 1990, after slower population growth (if not development activity) between 1970 and 1990. While overall County population has grown, the annexation policies of communities have led to decreasing populations within the County’s jurisdiction. The metropolitan area’s growth has also spread to other counties over the years as Douglas County’s share of the three-County area population (Douglas, Sarpy, and Pottawattamie Counties) has decreased.
| 1979 | 1997 | 2006 | 2015 | |
|---|---|---|---|---|
| Douglas County | 389,450 | 442,266 | 482,112 | 537,655 |
| County Jurisdiction | 4,684 | 2,509 | 2,762 | 1,778 |
| % of Total County Population | 1.20% | 0.56% | 0.57% | 0.33% |
| Area of Planning Jurisdiction (sq. miles) | 142.1 | 78 | 72.43 | 55.65 |
| Population per Square Mile | 27.1 | 32.1 | 38.1 | 30.6 |
| Communities | 323,845* | 347,343* | 427,808* | 451,656 |
| Community ETJs | 60,921 | 92,414 | 51,542 | 84,221 |
| 1940 | 1950 | 1960 | 1970 | 1980 | 1990 | 2000 | 2010 | 2015 Estimate | % Change 2000- 2010 | |
|---|---|---|---|---|---|---|---|---|---|---|
| Douglas County Communities | 247,562 | 281,020 | 343,490 | 389,455 | 397,038 | 416,444 | 463,585 | 517,110 | 537,655 | 11.55% |
| Bennington | 326 | 315 | 341 | 683 | 631 | 866 | 937 | 1,458 | 1,608 | 55.60% |
| Boys Town | 254 | 975 | 997 | 989 | 622 | 794 | 818 | 745 | 913 | -8.92% |
| Elkhorn | 429 | 476 | 749 | 1,184 | 1,344 | 1,398 | 6,062 | - | - | — |
| Omaha | 223,844 | 251,117 | 301,598 | 346,929 | 313,939 | 335,795 | 390,007 | 408,958 | 440,034 | 4.86% |
| Ralston | 834 | 1,300 | 2,977 | 4,731 | 5,143 | 6,236 | 6,314 | 5,943 | 5,997 | -5.88% |
| Valley | 985 | 1,113 | 1,452 | 1,595 | 1,716 | 1,775 | 1,788 | 1,875 | 2,018 | 4.87% |
| Waterloo | 381 | 382 | 516 | 455 | 450 | 479 | 459 | 848 | 1,086 | 84.75% |
| Unincorporated Areas | 20,509 | 25,342 | 34,860 | 32,889 | 73,193 | 69,101 | 57,200 | 97,283 | 85,999 | 70.08% |
| Unincorporated Pop as a % of Douglas Co. Total | 8.28% | 9.02% | 10.15% | 8.44% | 18.43% | 16.59% | 12.34% | 18.81% | 16.00% | — |
| 3-County Area | 325,153 | 366,395 | 457,873 | 542,646 | 569,614 | 601,655 | 673,884 | 769,108 | 800,060 | 14.13% |
| Douglas Co as a % of 3-County Area | 76.14% | 76.70% | 75.02% | 71.77% | 69.70% | 69.22% | 68.79% | 67.24% | 67.20% | — |
3-County Area of Douglas, Sarpy and Pottawattamie Counties Source: U.S. Census Bureau, 2005
*Based on 1980, 1990, and 2000 census counts
Source: A Comprehensive Development Plan for Douglas County, 1998 and 2006; U.S. Census Bureau
Recent Development Trends
The 1998 Douglas County Comprehensive Plan estimated the population within the County’s planning jurisdiction at 2,509, compared to 4,684 in 1979. Between the 1998 Plan and the 2006 Plan there was a small increase in the population within the County’s planning jurisdiction. Like the 1980s and early 1990s, annexations during the 2010s resulted in a decrease of this population once again. Municipal annexations have reduced the County’s planning area by 23% (Table 1.2). Since the completion of the 2006 Plan, growth in both the County and City of Omaha’s jurisdiction has slowed, with a greater portion of the city’s growth occurring through infill development.
Table 1.3 summarizes housing unit change since 2000. Annexations and much slower construction since 2008 have resulted in a slight decline in the number of housing units over the five-year period between 2010 and 2015. Immediately to the south, Sarpy County has also experienced a slower rate of new home construction, going from an annualized rate of 1,695 additional units between 2000 and 2010 to 589 units per year between 2010 and 2015.
| 2000 | 2010 | 2015 | Change | |
|---|---|---|---|---|
| Douglas County (excluding communities) | 20,997 | 37,495 | 31,959 | 10,962 |
| Owner | 17,390 | 29,737 | 26,250 | 8,860 |
| Renter | 2,303 | 5,769 | 6,397 | 4,094 |
| Bennington | 359 | 626 | 691 | 332 |
| Owner | 259 | 404 | 425 | 166 |
| Renter | 87 | 152 | 217 | 130 |
| Elkhorn | 2,034 | — | — | — |
| Owner | 1,781 | — | — | — |
| Renter | 219 | — | — | — |
| Omaha | 165,731 | 177,518 | 188,352 | 22,621 |
| Owner | 93,449 | 94,815 | 100,484 | 7,035 |
| Renter | 63,289 | 67,812 | 73,280 | 9,991 |
| Ralston | 2,601 | 2,711 | 2,710 | 109 |
| Owner | 1,782 | 1,734 | 1,644 | (138) |
| Renter | 756 | 847 | 958 | 202 |
| Valley | 760 | 871 | 916 | 156 |
| Owner | 453 | 478 | 536 | 83 |
| Renter | 243 | 326 | 349 | 106 |
| Waterloo | 190 | 359 | 418 | 228 |
| Owner | 140 | 231 | 223 | 83 |
| Renter | 43 | 106 | 168 | 125 |
| Sarpy County | 44,981 | 61,938 | 64,886 | 19,905 |
| Owner | 30054 | 41,350 | 43,241 | 13,187 |
| Renter | 13372 | 16,752 | 18,742 | 5,370 |
Source: U.S. Census Bureau
Source: U.S. Census Bureau
Population Projections
Projecting Douglas County’s future population is complicated by two factors – the relationship between Douglas County’s growth and that of the metropolitan region; and the limited supply of land within the Papillion Creek watershed. The 2006 Plan cited:
Bureau of Business Research population projections, prepared in 1999, suggest a potential County population of 663,403 by 2050. However, the limited amount of land within Omaha’s urban services area, incorporating the Papillion Creek watershed, could affect the ability of the County to reach this population. Outside of the Papillion watershed, Valley and Waterloo provide municipal sewer service; Valley has recently completed a force main that directs its wastewater for treatment at the City of Fremont’s plant. However, development outside of these systems cannot easily be provided with sewer service.
Using current trends, the City of Omaha Planning Department estimates that 16.3 square miles of land are developed every 10 years, indicating that the Papillion Creek watershed within Douglas County will be fully developed by 2025. The current Douglas County planning jurisdiction contains about 7,500 acres (11.7 square miles) within the Papillion watershed. Based on the rates cited by the City of Omaha, this area will be absorbed by urban development in less than 10 years.
This discussion underlines the importance of future development decisions within all of the County’s watersheds. The density of development within the County’s jurisdiction will determine the ultimate population for the County, and suggests that land capable of receiving municipal wastewater service should be used efficiently. A failure to do so will cause regional population growth to become more dispersed, increasing the cost of services and transportation, and producing potential conflicts between agriculture and urban uses.
“Current trends” did not result in the balance of the watershed being “absorbed by urban development in less than 10 years.” The change in development patterns since the completion of the 2006 Plan demonstrates how difficult it is to project future population growth, especially in a jurisdiction that is closely tied to the development decisions made by other jurisdictions.
The Metropolitan Area Planning Agency’s Long Range Transportation Plan estimates a 2040 population for Douglas County at 610,968. The population within the County’s jurisdiction has ranged between 1.2% and 0.3% of the County’s total population (see Table 1.2). If it is assumed that over time this proportion falls between 0.5% and 0.3%, then the 2040 population would be between 3,054 and 1,833.
Ultimately, the amount of population is not as important as the type of development. First Principle 5 (see Chapter 4) stresses the importance of planning for higher densities in those areas in which full municipal services can be provided. Densities that can support public transit options will then better support a wider range of housing options (see First Principle 14), new jobs related to local food production, and transportation to and from those jobs.
Land Use
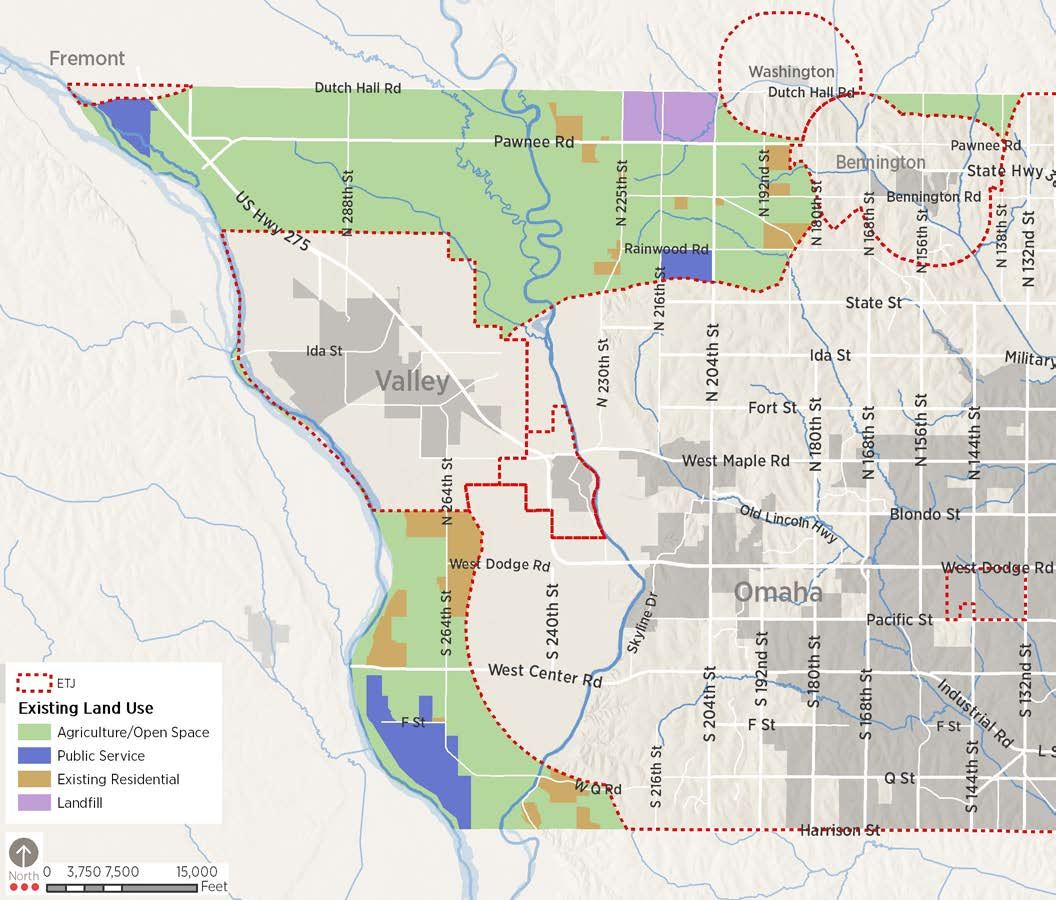
Map 1.1 displays the distribution of existing land uses in Douglas County’s planning jurisdiction in 2018. Information was gathered from historic data and field verified. Table 1.4 summarizes the number of acres within the County for each land use.
| Acres | % of Total Area | |
|---|---|---|
| Residential | 2,734 | 7.7% |
| Public Land | 2,323 | 6.5% |
| Landfill | 1,086 | 3.0% |
| Agriculture/Open Space | 29,542 | 82.8% |
| Total | 35,685 | — |
Agricultural and Open Land
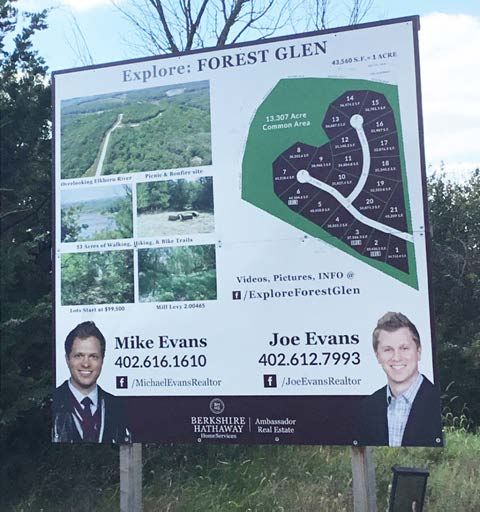
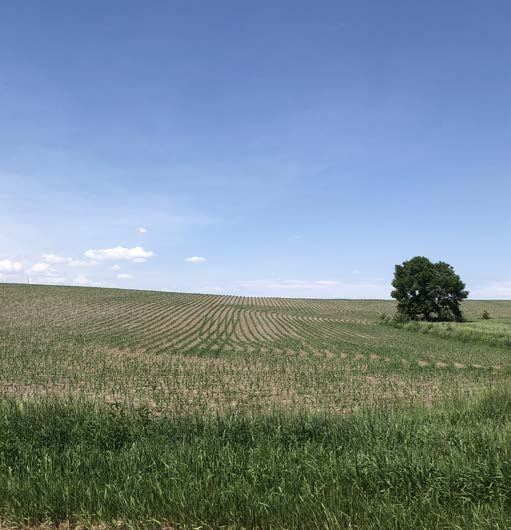
Agriculture remains the dominant land use in the planning jurisdiction, giving the area its distinctive rural quality. Much of this agricultural land is located in the extreme northwest part of the County. Crop production is dominant in the Elkhorn and Platte River floodplains, with urban development slowly moving westward in the undulating uplands east of the Elkhorn River. In general, new development in the metropolitan area has occurred within municipal planning jurisdictions and has been relatively contiguous to existing urban development. Exceptions since 1998 include Westshores, a lake community south of Dodge Street between 240th and 252nd; and the Hamptons/South Hamptons and Forest Glen subdivisions along West Q Street at about 240th Street.
Residential Uses
The majority of the residential development in the County is in the form of rural estates (typically on lots over an acre in size) or farmsteads. Some newer developments such as the Hamptons and Forest Glen have developed at higher densities and connect to community wastewater and water systems.
Public Land & Land Fill
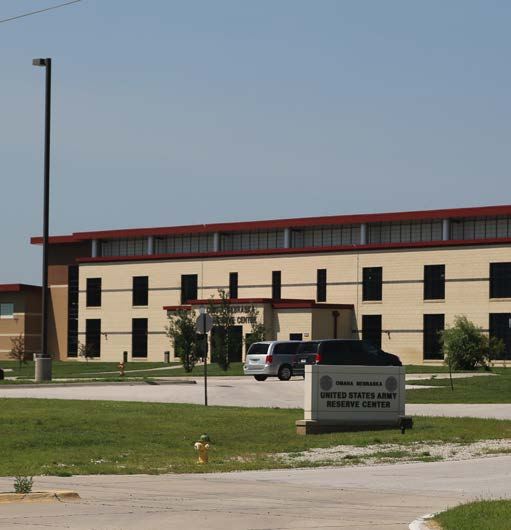
The overall amount of public land has decreased only slightly due to annexations, but the dramatic decline in other land uses means that nearly 10% of all land in the County’s jurisdiction is publicly owned.
These uses include:
- Two Rivers State Recreation Area south of Highway 92 along the Platte River.
- The Pheasant Point Landfill along Highway 36 west of 204th Street.
- The Metropolitan Utilities District (MUD) well field at 264th and Q Street.
- The Fremont Wellfield in the extreme northwestern corner of the County.
- A United States Air Force communications antenna facility that is located to the west of Highway 31 and north of State Street.
Water Surfaces and Water-Related Uses
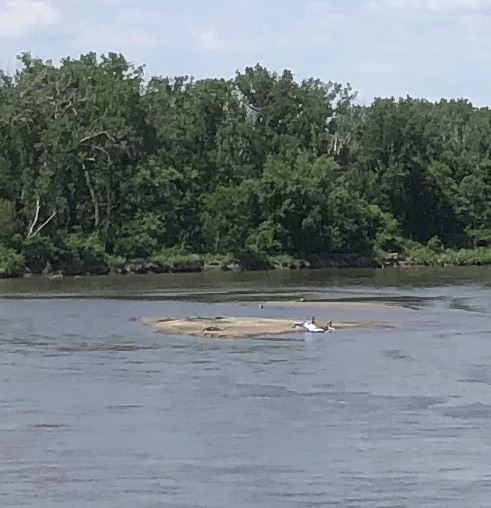
Major water features consist of the region’s two principal rivers, the Platte and the Elkhorn. The planning jurisdiction’s largest recreation facility, Two Rivers State Recreation Area, is located near the confluence of these two important waterways. Other bodies of water include smaller tributaries to the rivers, several sand and gravel pit lakes, and small farm and stock ponds. These bodies of water can attract other forms of development. For example, gravel pit lakes are frequently converted to residential uses after extraction activities are complete.
Land Use Issues
While much of the County’s planning jurisdiction remains unchanged since the completion of the 2006 Douglas County Comprehensive Plan, issues related to urban fringe development remain concerns for residents. Some of those issues include:
- The quality of development
- Connectivity between developments
- How stormwater is managed
- How water and sewer services are provided
The expanding urban fringe of Omaha slowed during the recession but a housing market that sees a continued demand for workforce housing could see a reversal of this trend during the life of this plan. Much of that development demand should be absorbed in the jurisdiction of the County’s municipalities, while developments that can occur outside of the Papillion Creek watershed must manage the issues identified above.